Google is letting everyone create 10 free AI videos in Gemini through August 4, 2026. Here's exactly how to claim them, step by step, before the offer ends.
Gemini’s Free 10-Video Offer: How to Use It Before August 4th

Exploring generative AI, new technologies, and platforms, and sharing ideas that shape how we work, learn, and communicate.
Google is letting everyone create 10 free AI videos in Gemini through August 4, 2026. Here's exactly how to claim them, step by step, before the offer ends.

WhatsApp just overhauled CarPlay and Android Auto, added iPad-only sign-up, in-chat PDF editing, and Status music sharing. Here's what changed and how to use each one.

Hundreds of shared Claude conversations turned up in Google search. It has happened to ChatGPT, Grok and Meta AI too. Here is the ten-minute audit that keeps your AI chats private, platform by platform.

1of10 turns a video title into a finished YouTube thumbnail in seconds. Here is the full step by step workflow, what it actually delivers, and where it falls short.

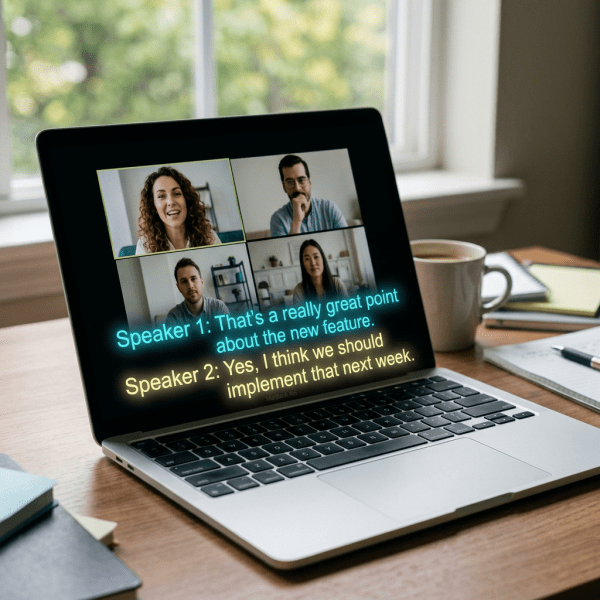
Meetily transcribes and summarizes meetings 100% locally. No cloud, no bots, free and open source. Here's how it works and how to set it up.

OpenAI launched ChatGPT Work on July 9, 2026. Here's what the agent actually builds, how to set it up, and where it still needs a human check.

HyperTexting turns RSS feeds into a social style timeline with no ads or algorithm. Here's how to set it up on iPhone and who it's actually for.
DeepL Voice for Meetings now works with Google Meet, giving translated captions Slator found nearly 2x more accurate than Meet's own. Here's how to set it up.

Meta's Muse Image lets strangers remix your public Instagram photos with AI, no notice given. Here's the exact toggle to shut it off.

Fable 5's free window is over, but Claude Code gets 50% higher weekly limits and Cowork gets 2x usage through August. Here's the full breakdown.
