
Introduction: The Power of AI in Financial Analysis
In today’s data-driven world, financial analysis tools have become essential for businesses and individuals alike to make informed decisions about their finances. However, creating these tools traditionally required extensive coding knowledge or expensive software subscriptions. Enter Perplexity Labs – a revolutionary AI-powered platform that allows anyone to build sophisticated financial analysis tools without writing a single line of code.

A user analyzing financial data through the Perplexity Labs interface
Launched in May 2025, Perplexity Labs represents a significant evolution in how we approach financial analysis and project creation. As a Pro subscriber feature ($20/month), Labs enables you to transform simple prompts into fully functional financial dashboards, reports, and even interactive web applications – all backed by extensive research and data analysis.
What Makes Perplexity Labs Different?
Unlike traditional financial software that requires technical expertise, Perplexity Labs democratizes financial analysis by making it accessible to everyone. The platform combines deep web research, code execution, and data visualization capabilities to deliver polished outputs in about 10 minutes – a process that would typically take days of work and coordination across multiple skills.
What truly sets Labs apart is its ability to perform approximately 10 minutes of self-supervised work, leveraging a suite of tools to transform your ideas into tangible outputs. This means Labs can accomplish in minutes what would traditionally take days of work, extensive research, and coordination across multiple skill sets.
Key features that make Perplexity Labs ideal for financial analysis include:
- Code Generation & Execution: Labs writes and executes code to handle tasks such as structuring data and creating charts without requiring you to have programming skills
- Data Visualization: The platform excels at visualizing financial data through interactive charts and images
- Asset Management: All generated files, including documents, spreadsheets, charts, and code files, are organized in an accessible “Assets” tab
- Mini App Development: Labs can create simple interactive web applications for dynamic financial analysis
Getting Started with Perplexity Labs for Financial Analysis
Step 1: Access Perplexity Labs
To begin creating your custom financial analysis tools, you’ll need to:
- Sign up for a Perplexity Pro subscription ($20/month)
- Log into your account and look for the mode selector in the input bar
- Click on the light bulb (💡) icon to switch to Labs mode
Step 2: Understand the Interface
When you create a Lab, you’ll notice it looks different from a standard Perplexity chat. The interface includes:
- Tasks: Shows all the steps Labs took to create your project
- Report: Displays the final report with visual assets and comprehensive analysis
- Assets: Contains all downloadable content like charts, graphs, images, and data files
- App (if applicable): Provides access to any interactive web application created
- Sources: Lists all the sources Labs used to generate the report
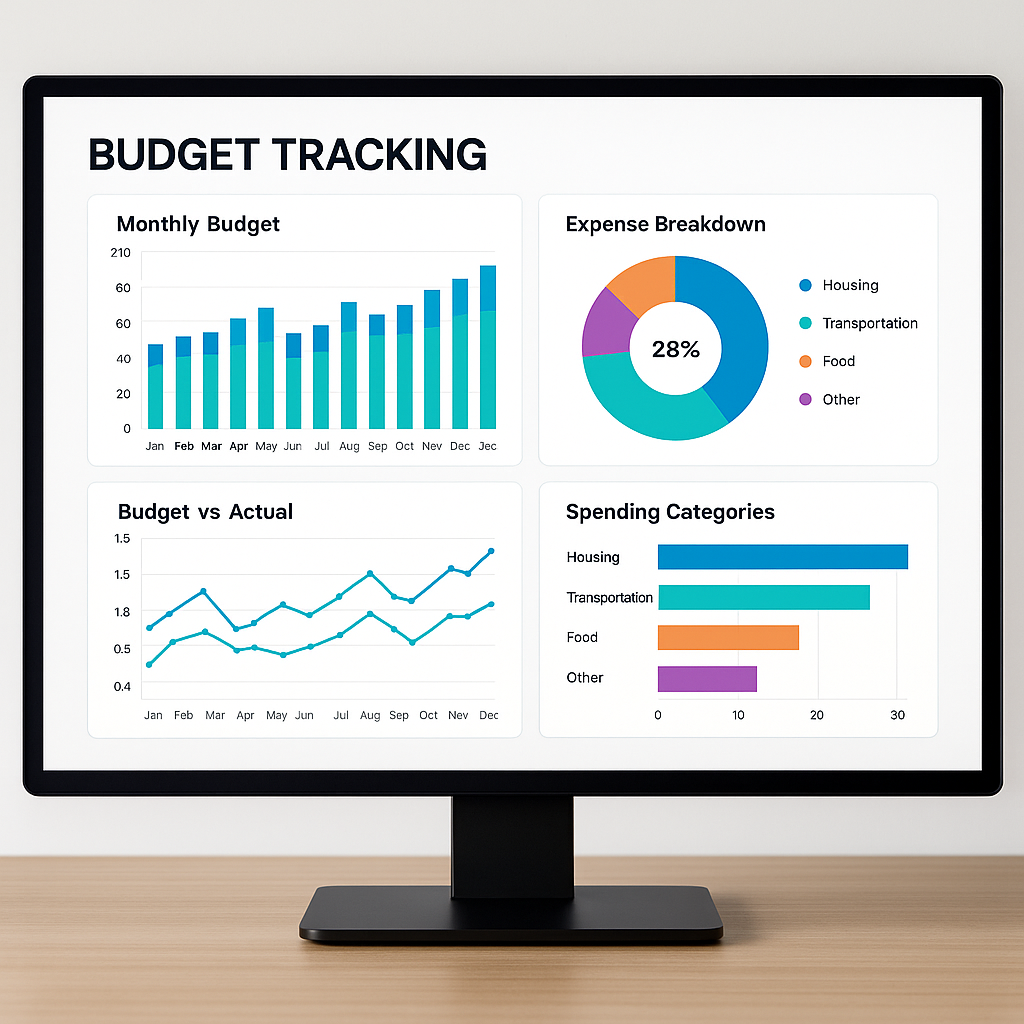
A modern financial dashboard displaying budget tracking metrics with interactive charts
Step 3: Craft Your Financial Analysis Prompt
The quality of your financial analysis tool largely depends on the quality of your prompt. Here are some tips for creating effective financial analysis prompts:
- Be specific about your financial goals: Instead of asking for “a financial dashboard,” specify “a financial dashboard tracking quarterly revenue, expenses, and profit margins for a small e-commerce business”
- Provide context: Include background information about your financial situation or business to help Labs understand the purpose of your analysis
- Specify output format: Clearly state what type of deliverable you want, whether it’s a report, dashboard, or web application
- Include relevant parameters: If your analysis involves specific data points or time frames, include these in your prompt
Creating Different Types of Financial Analysis Tools
1. Budget Tracking Dashboard
A budget tracking dashboard helps you visualize your income, expenses, and savings over time, making it easier to identify spending patterns and areas for improvement.
Sample Prompt:
“Create an interactive personal finance dashboard to track my monthly expenses, savings, and investment growth. Include visualizations for expense categories, income vs. expenses over time, and savings rate. Add filters to analyze spending by month and category.”
The resulting dashboard will typically include:
- Income vs. expenses comparison charts
- Expense breakdown by category
- Monthly savings rate tracker
- Budget vs. actual spending analysis
2. Investment Portfolio Analysis Tool
An investment portfolio analysis tool helps you evaluate the performance of your investments, assess risk levels, and identify opportunities for optimization.

A mobile portfolio analysis application showing investment performance metrics
Sample Prompt:
“Create a comprehensive investment portfolio analysis dashboard that compares the performance of traditional stock investments versus AI-powered ones. Include sections for sentiment impact analysis, macroeconomic trend visualization, and portfolio composition. Use historical data from the past 5 years and provide risk assessment metrics.”
The resulting tool will typically include:
- Portfolio performance metrics and comparisons
- Asset allocation visualization
- Risk assessment tools (volatility, Sharpe ratio, etc.)
- Historical performance charts with benchmark comparisons
3. Cash Flow Forecasting Tool
Cash flow forecasting is essential for businesses to ensure they have enough liquidity to meet their obligations. A cash flow forecasting tool helps predict future cash positions based on historical data and trends.
Sample Prompt:
“Build a cash flow forecasting tool that predicts my business’s cash position for the next 6 months. Use historical data patterns to project future revenue and expenses. Include visualizations for cash inflows, outflows, and net cash changes. Add the ability to adjust key variables to see different scenarios.”
The resulting tool will typically include:
- Cash flow projection charts
- Revenue and expense forecasts
- Scenario analysis capabilities
- Early warning indicators for potential cash shortages
Advanced Features and Tips
Uploading Your Own Financial Data
While Perplexity Labs can generate synthetic data for demonstration purposes, you’ll get the most value by using your actual financial data. Here’s how to incorporate your own data:
- Prepare your data: Organize your financial data in a CSV file with clear column headers
- Mention the data in your prompt: Specify that you want to upload your own data in the prompt
- Follow the upload instructions: Labs will guide you through the process of uploading your CSV file
Customizing Your Financial Dashboards
To make your financial analysis tools more effective, consider these customization tips:
- Focus on key metrics: Include the most relevant financial metrics for your specific needs, such as revenue, expenses, profits, cash flow, and accounts receivable
- Add interactive elements: Request filters, sliders, or dropdown menus to make your dashboard more interactive
- Include comparative analysis: Ask for year-over-year or month-over-month comparisons to identify trends
- Request scenario modeling: Include the ability to adjust variables and see how they affect financial outcomes
Real-World Applications
For Small Business Owners
Small business owners can use Perplexity Labs to create financial analysis tools that would otherwise require expensive accounting software or consultants. Examples include:
- Profit and loss dashboards to track business performance
- Cash flow management tools to ensure adequate liquidity
- Budget vs. actual analysis to control expenses
- Revenue forecasting tools to plan for future growth
For Personal Finance Management
Individuals can use Perplexity Labs to gain better control over their personal finances. Examples include:
- Expense tracking dashboards to monitor spending habits
- Investment portfolio analysis tools to optimize returns
- Retirement planning calculators to ensure adequate savings
- Debt reduction planners to strategize loan repayments
For Financial Professionals
Financial advisors and analysts can use Perplexity Labs to create client-facing tools that enhance their service offerings. Examples include:
- Client portfolio performance dashboards
- Financial planning scenario models
- Risk assessment visualizations
- Market trend analysis tools
Conclusion: Democratizing Financial Analysis
Perplexity Labs is revolutionizing the way we approach financial analysis by making sophisticated tools accessible to everyone, regardless of their technical background. By leveraging the power of AI, you can now create custom financial analysis tools that would traditionally require extensive coding knowledge or expensive software subscriptions.
The platform’s ability to combine deep research, code execution, and data visualization in a single environment makes it an invaluable resource for businesses, individuals, and financial professionals alike. As AI technology continues to evolve, tools like Perplexity Labs are redefining what’s possible in terms of financial analysis and decision-making.
Ready to transform your financial analysis capabilities? As a Perplexity Pro subscriber, you now have a powerful ally in your productivity arsenal. Start exploring Perplexity Labs today and discover how it can revolutionize your approach to financial management and analysis.

Leave a comment